


Page 17 - CII-ARTHA
P. 17
MARCH 2026


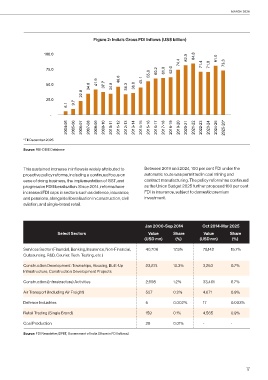
                                           Figure 2: India's Gross FDI Inflows (US$ billion)


                     100.0                                                          82.0   84.8
                                                                                 74.4      71.4   71.0   81.0   73.3
                      75.0                                         55.6   60.2   61.0   62.0

                                            41.9      46.6      45.1
                      50.0               34.8   37.7   34.8   34.3   36.0
                                     22.8
                      25.0
                               6.1   9.7

                        -
                               2004-05  2005-06  2006-07  2007-08  2008-09  2009-10  2010-11  2011-12  2012-13  2013-14  2014-15  2015-16  2016-17  2017-18  2018-19  2019-20  2020-21  2021-22  2022-23  2023-24  2024-25  2025-26*


           *Till December 2025

           Source: RBI-DBIE Database


           This sustained increase in inflows is widely attributed to   Between 2019 and 2024, 100 per cent FDI under the
           proactive policy reforms, including a continued focus on   automatic route was permitted in coal mining and
           ease of doing business, the implementation of GST, and   contract manufacturing. The policy reform has continued
           progressive FDI liberalisation. Since 2014, reforms have   as the Union Budget 2025 further proposed 100 per cent
           increased FDI caps in sectors such as defence, insurance,   FDI in insurance, subject to domestic premium
           and pensions, alongside liberalisation in construction, civil   investment.
           aviation, and single-brand retail.


                                                                 Jan 2000-Sep 2014         Oct 2014-Mar 2025
                           Select Sectors                          Value      Share        Value       Share
                                                                 (USD mn)      (%)        (USD mn)      (%)
           Services Sector (Financial, Banking, Insurance, Non-Financial,   40,706   17.5%   78,142     15.7%
           Outsourcing, R&D, Courier, Tech. Testing, etc.)

           Construction Development: Townships, Housing, Built-Up   23,874    10.3%        3,253        0.7%
           Infrastructure, Construction Development Projects

           Construction (Infrastructure) Activities               2,698       1.2%         33,461       6.7%

           Air Transport (Including Air Freight)                  537         0.2%         4,671        0.9%

           Defence Industries                                     5           0.002%       17           0.003%

           Retail Trading (Single Brand)                          159         0.1%         4,565        0.9%

           Coal Production                                        28          0.01%        -            -

           Source: FDI Newsletter, DPIIT, Government of India [Share in FDI Inflows]


                                                                                                              17

