


Page 18 - CII-ARTHA
P. 18
ARTHA


         Salient features of FDI into India                    Competition from other emerging economies has also
                                                               intensified. ASEAN economies, such as Vietnam and
         Accumulating over US$1 trillion in FDI over the last two   Indonesia, continue to attract substantial inflows, while
         decades stands as a significant achievement for India.   Mexico has seen a surge in FDI driven by nearshoring,
         However, a closer assessment suggests that            with inflows reaching US$21.4 billion in Q1 2025, a
                                                                                        7
         considerable untapped potential remains.              5.4 per cent increase over 2024 . More importantly, the
                                                               scale and consistency of inflows into ASEAN economies
                                                               offer a key lesson. These economies have historically
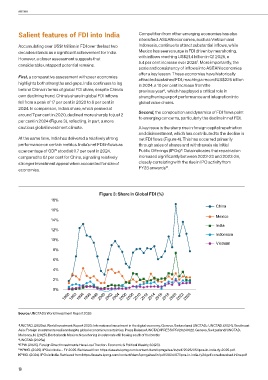
         First, a comparative assessment with peer economies   attracted sustained FDI, reaching a record US$225 billion
         highlights both strengths and gaps. India continues to lag   in 2024, a 10 per cent increase from the
         behind China in terms of global FDI share, despite China’s   previous year ,  which has played a critical role in
                                                                          8
         own declining trend. China’s share in global FDI inflows   strengthening export performance and integration into
         fell from a peak of 17 per cent in 2020 to 8 per cent in   global value chains.
         2024. In comparison, India’s share, which peaked at
         around 7 per cent in 2020, declined more sharply to just 2   Second, the composition and dynamics of FDI flows point
                                                               to emerging concerns, particularly the decline in net FDI.
         per cent in 2024 (Figure 3), reflecting, in part, a more
         cautious global investment climate.                   A key issue is the sharp rise in foreign capital repatriation
                                                               and disinvestment, which has contributed to the decline in
         At the same time, India has delivered a relatively strong   net FDI flows (Figure 4). This has occurred primarily
         performance on certain metrics. India’s net FDI inflows as   through sales of shares and withdrawals via Initial
         a percentage of GDP stood at 0.7 per cent in 2024,    Public Offerings (IPOs) . Data indicates that repatriation
                                                                                 9
         compared to 0.1 per cent for China, signalling relatively   increased significantly between 2022-23 and 2023-24,
         stronger investment appeal when accounted for size of   closely correlating with the rise in IPO activity from
                                                                           10
         economies.                                            FY23 onwards .


                                             Figure 3: Share in Global FDI (%)
                        18%
                                                                                                 China
                        16%
                                                                                                 Mexico
                        14%
                                                                                                 India
                        12%
                                                                                                 Indonesia
                        10%
                                                                                                 Vietnam
                         8%

                         6%

                         4%

                         2%
                         0%
                             1990  1992  1994  1996  1998  2000  2002  2004  2006  2008  2010  2012  2014  2016  2018  2020  2022  2024


         Source: UNCTAD’s World Investment Report 2025


         7 UNCTAD. (2025a). World Investment Report 2025: International investment in the digital economy. Geneva, Switzerland: UNCTAD.;  UNCTAD. (2024). Southeast
         Asia: Foreign investments resilient despite global economic uncertainties. Press Release UNCTAD/PRESS/PR/2024/022. Geneva, Switzerland: UNCTAD.
         Mahoney, N. (2025). Borderlands Mexico: Nearshoring investments still flowing south of the border
         8 UNCTAD (2025a)
         9 EPW. (2025). Foreign Direct Investments Have Lost Traction. Economic & Political Weekly, 60(23).
         10 KPMG. (2025). IPOs in India – FY 2025. Retrieved from https://assets.kpmg.com/content/dam/kpmgsites/in/pdf/2025/05/ipos-in-india-fy-2025.pdf.
         KPMG. (2024). IPOs in India. Retrieved from https://assets.kpmg.com/content/dam/kpmgsites/in/pdf/2024/07/ipos-in-india-fy24.pdf.coredownload.inline.pdf


         18

