


Page 35 - CII-ARTHA
P. 35
MARCH 2026


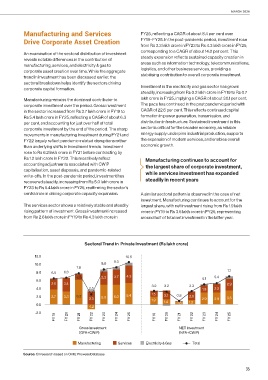
            Manufacturing and Services                          FY25, reflecting a CAGR of about 8.4 per cent over
            Drive Corporate Asset Creation                      FY19–FY25. In the post-pandemic period, investment rose
                                                                from Rs 3.3 lakh crore in FY23 to Rs 4.3 lakh crore in FY25,
                                                                corresponding to a CAGR of about 14.0 per cent. This
            An examination of the sectoral distribution of investment
            reveals notable differences in the contribution of   steady expansion reflects sustained capacity creation in
            manufacturing, services, and electricity & gas to   areas such as information technology, telecommunications,
            corporate asset creation over time. While the aggregate   logistics, and other business services, providing a
            trend in investment has been discussed earlier, the   stabilising contribution to overall corporate investment.
            sectoral breakdown helps identify the sectors driving
            corporate capital formation.                        Investment in the electricity and gas sector has grown
                                                                steadily, increasing from Rs 0.2 lakh crore in FY19 to Rs 0.7
            Manufacturing remains the dominant contributor to   lakh crore in FY25, implying a CAGR of about 30.1 per cent.
            corporate investment over the period. Gross investment   The pace has continued in the post pandemic period with
            in the sector increased from Rs 3.7 lakh crore in FY19 to   CAGR of 22.6 per cent. This reflects continued capital
            Rs 5.4 lakh crore in FY25, reflecting a CAGR of about 6.3   formation in power generation, transmission, and
            per cent, and accounting for just over half of total   distribution infrastructure. Sustained investment in this
            corporate investment by the end of the period. The sharp   sector is critical for the broader economy, as reliable
            movements in manufacturing investment during FY21 and   energy supply underpins industrial production, supports
            FY22 largely reflect pandemic-related disruptions rather   the expansion of modern services, and enables overall
            than underlying shifts in investment trends. Investment   economic growth.
            rose to Rs 6.2 lakh crore in FY21 before contracting by
            Rs 1.2 lakh crore in FY22. This most likely reflect    Manufacturing continues to account for
            accounting adjustments associated with CWIP           the largest share of corporate investment,
            capitalisation, asset disposals, and pandemic-related
            write-offs. In the post-pandemic period, investment has   while services investment has expanded
            recovered steadily, increasing from Rs 5.0 lakh crore in   steadily in recent years
            FY23 to Rs 5.4 lakh crore in FY25, reaffirming the sector’s
            central role in driving corporate capacity expansion.  A similar sectoral pattern is observed in the case of net
                                                                investment. Manufacturing continues to account for the
            The services sector shows a relatively stable and steadily   largest share, with net investment rising from Rs 1.9 lakh
            rising pattern of investment. Gross investment increased   crore in FY19 to Rs 3.5 lakh crore in FY25, representing
            from Rs 2.6 lakh crore in FY19 to Rs 4.3 lakh crore in   around half of total net investment in the latter year.


                                       Sectoral Trend in  Private Investment (Rs lakh crore)

                 12.0                                    10.5
                                                    9.3
                 10.0                         8.8
                                   7.8
                 8.0    6.5  6.6                                                                      7.1
                                   1.3        3.3   3.7  4.3                               5.1  5.4
                 6.0
                        2.6  3.4                                    3.2   3.2        3.3              2.9
                 4.0                     2.5                                               1.9  2.2

                 2.0    3.7  3.3   6.2        5.0   5.0  5.4        1.5   2.1  0.8   2.0
                                         3.3                        1.9                    2.9  2.9   3.5
                 0.0                                                      1.4  0.8   1.2
                                         -1.2
                 -2.0
                         FY 19  FY 20  FY 21  FY 22  FY 23  FY 24  FY 25  FY 19  FY 20  FY 21  FY 22  FY 23  FY 24  FY 25

                                    Gross Investment                             NET Investment
                                    (GFA+CWIP)                                   (NFA+CWIP)
                                    Manufacturing    Services     Electricity & Gas    Total


           Source: CII research based on CMIE Prowess Database

                                                                                                              35

