


Page 37 - CII-ARTHA
P. 37
MARCH 2026


           Manufacturing and Power Lead                          In contrast, investment announcements in construction &

           the Investment Pipeline                               real estate declined from Rs 1.6 lakh crore in
                                                                 April–December 2024 to about Rs 1.0 lakh crore in the
                                                                 corresponding period of 2025, representing a contraction
           The sectoral composition of new private investment    of around 38 per cent.
           announcements suggests that the increase in FY26 so
           far has been driven primarily by manufacturing and    Overall, the sectoral pattern suggests that the pickup in
           electricity, pointing to a renewed emphasis on industrial   private investment announcements during FY26 so far has
           capacity expansion and energy infrastructure.         been driven primarily by manufacturing and electricity

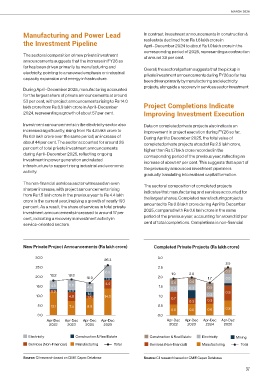
           During April–December 2025, manufacturing accounted   projects, alongside a recovery in services sector investment.
           for the largest share of private announcements at around
           53 per cent, with project announcements rising to Rs 14.0
           lakh crore from Rs 8.9 lakh crore in April–December   Project Completions Indicate
           2024, representing a growth of about 57 per cent.     Improving Investment Execution

           Investment announcements in the electricity sector also   Data on completed private projects also indicate an
           increased significantly, rising from Rs 4.8 lakh crore to  improvement in project execution during FY26 so far.
           Rs 6.9 lakh crore over the same period, an increase of   During April to December 2025, the total value of
           about 44 per cent. The sector accounted for around 26   completed private projects stood at Rs 2.5 lakh crore,
           per cent of total private investment announcements    higher than Rs 1.7 lakh crore recorded in the
           during April–December 2025, reflecting ongoing         corresponding period of the previous year, reflecting an
           investment in power generation and related            increase of about 47 per cent. This suggests that a part of
           infrastructure to support rising industrial and economic   the previously announced investment pipeline is
           activity.                                             gradually translating into realised capital formation.

           The non-financial services sector witnessed an even    The sectoral composition of completed projects
           sharper increase, with project announcements rising   indicates that manufacturing and services accounted for
           from Rs 1.5 lakh crore in the previous year to Rs 4.4 lakh   the largest shares. Completed manufacturing projects
           crore in the current year, implying a growth of nearly 193
           per cent. As a result, the share of services in total private   amounted to Rs 0.8 lakh crore during April to December
           investment announcements increased to around 17 per   2025, compared with Rs 0.6 lakh crore in the same
           cent, indicating a recovery in investment activity in   period of the previous year, accounting for around 32 per
           service-oriented sectors.                             cent of total completions. Completions in non-financial


           New Private Project Announcements (Rs lakh crore)         Completed Private Projects (Rs lakh crore)

                 30.0                                                  3.0
                                               26.3
                                                                                                     2.5
                 25.0                                                  2.5
                                                6.9                          1.9     2.0             0.3
                 20.0  18.2    18.8    16.9     1.0                    2.0           0.4     1.7     0.5

                 15.0   4.5     5.6     4.8     4.4                     1.5  0.4     0.3     0.5
                                                                             0.3
                        0.9     0.9                                                                  0.8
                 10.0           4.8     1.6     14.0                   1.0   0.7             0.3
                                        1.5
                                                                                     0.3     0.3
                  5.0   12.1    7.4     8.9                            0.5
                                                                             0.6     0.6     0.6     0.8
                  0.0                                                  0.0
                      Apr-Dec  Apr-Dec  Apr-Dec  Apr-Dec                   Apr-Dec  Apr-Dec  Apr-Dec  Apr-Dec
                       2022    2023    2024    2025                         2022    2023    2024    2025


              Electricity          Construction & Real Estate       Construction & Real Estate  Electricity  Mining
              Services (Non-Financial)  Manufacturing  Total        Services (Non-financial)  Manufacturing  Total

           Source: CII research based on CMIE Capex Database     Source: CII research based on CMIE Capex Database

                                                                                                              37

