


Page 55 - CII-ARTHA
P. 55
MARCH 2026


           Thus, fiscal deficits increasingly reflect a structural
           mismatch between revenue capacity and expenditure         Gross Fiscal Deficit of All States (% of GDP)
           commitments, making them a central indicator of                    4.1
           underlying fiscal health of states. In this context, this                                 3.5
           article examines the evolving dynamics of state finances,                            2.9       3.3
           focusing on the linkages between fiscal deficits, debt    2.4   2.6        2.8   2.7
           accumulation, and the changing composition of revenues
           and expenditures. It highlights the structural drivers of
           fiscal stress and assesses the implications for
           sustainability across states.


           Fiscal Deficit: From Discipline to

           Stress and Partial Recovery                               2018-19  2019-20  2020-21  2021-22  2022-23  2023-24  2024-25 (RE)  2025-26 (BE)

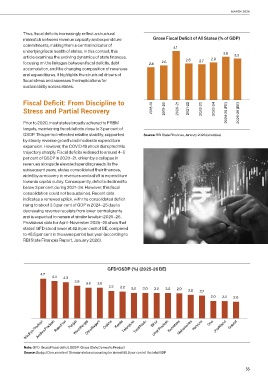
           Prior to 2020, most states broadly adhered to FRBM
           targets, maintaining fiscal deficits close to 3 per cent of
           GSDP. This period reflected relative stability, supported   Source: RBI State Finances, January 2026 (all states)
           by steady revenue growth and moderate expenditure
           expansion. However, the COVID-19 shock disrupted this
           trajectory sharply. Fiscal deficits widened to around 4–5
           per cent of GSDP in 2020–21, driven by a collapse in
           revenues alongside elevated spending needs. In the
           subsequent years, states consolidated their finances,
           aided by a recovery in revenues and a shift in expenditure
           towards capital outlay. Consequently, deficits declined to
           below 3 per cent during 2021–24. However, this fiscal
           consolidation could not be sustained. Recent data
           indicates a renewed uptick, with the consolidated deficit
           rising to about 3.3 per cent of GDP in 2024–25 due to
           decreasing revenue receipts from lower central grants
           and is expected to remain at similar levels in 2025–26.
           Provisional data for April–November 2025–26 show that
           states’ GFD stood lower at 42.8 per cent of BE, compared
           to 45.5 per cent in the same period last year (according to
           RBI State Finances Report, January 2026).


                                                 GFD/GSDP (%) (2025-26 BE)
                   4.7
                        4.4  4.3
                                  3.8
                                       3.6  3.6
                                                 3.2  3.2  3.0  3.0  3.0  3.0   2.9  2.8  2.7

                                                                                               2.0  2.0  2.0


                  Andhra Pradesh
            Madhya Pradesh  Rajasthan  Punjab West Bengal Chhattisgarh  Odisha  Kerala Telangana Tamil Nadu  Bihar Uttar Pradesh  Karnataka Maharashtra  Haryana  Goa  Jharkhand  Gujarat


            Note: GFD: Gross Fiscal deficit, GSDP: Gross State Domestic Product
            Source: Budget Documents of 18 major states accounting for almost 98.8 per cent of the total GDP


                                                                                                              55

