


Page 58 - CII-ARTHA
P. 58
ARTHA


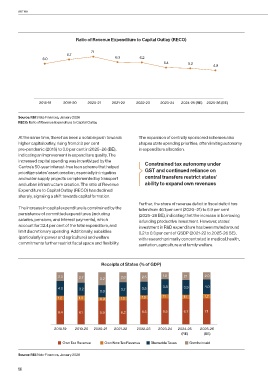
                                   Ratio of Revenue Expenditure to Capital Outlay (RECO)


                                          7.1
                               6.7
                    6.0                             6.3        6.2
                                                                          5.4        5.2
                                                                                                4.9


                  2018-19    2019-20    2020-21    2021-22   2022-23    2023-24   2024-25 (RE)  2025-26 (BE)


         Source: RBI State Finances, January 2026
         RECO: Ratio of Revenue Expenditure to Capital Outlay


         At the same time, there has been a notable push towards   The expansion of centrally sponsored schemes also
         higher capital outlay, rising from 2.3 per cent       shapes state spending priorities, often limiting autonomy
         pre-pandemic (2018) to 3.0 per cent in 2025–26 (BE),   in expenditure allocation.
         indicating an improvement in expenditure quality. The
         increased capital spending was incentivized by the
         Centre’s 50-year interest-free loan scheme that helped   Constrained tax autonomy under
         prioritize states’ asset creation, especially in irrigation   GST and continued reliance on
         and water supply projects complemented by transport     central transfers restrict states’
         and urban infrastructure creation. The ratio of Revenue   ability to expand own revenues
         Expenditure to Capital Outlay (RECO) has declined
         sharply, signaling a shift towards capital formation.
                                                               Further, the share of revenue deficit in fiscal deficit has
         The increase in capital expenditure is constrained by the   fallen from 46.1 per cent (2020–21) to 6.9 per cent
         persistence of committed expenditures (including      (2025–26 BE), indicating that the increase in borrowing
         salaries, pensions, and interest payments), which     is funding productive investment. However, states’
         account for 32.4 per cent of the total expenditure, and   investment in R&D expenditure has been muted around
         limit discretionary spending. Additionally, subsidies   0.2 to 0.3 per cent of GSDP (2021-22 to 2025-26 BE),
         (particularly in power and agriculture) and welfare   with research primarily concentrated in medical, health,
         commitments further restrict fiscal space and flexibility.   sanitation, agriculture and family welfare.


                                              Receipts of States (% of GDP)


                           2.3      2.7      3.2       2.6      2.5      1.8       2.1      2.0

                           4.0      3.2                3.7      3.5      3.8       3.9      4.0
                                             3.0
                           1.2      1.3      0.9       1.0      1.0      1.1       1.1      1.2


                           6.4      6.1      5.9       6.2      6.5      6.5       6.7      7.1


                         2018-19  2019-20  2020-21  2021-22   2022-23  2023-24  2024-25   2025-26
                                                                                  (RE)     (BE)
                             Own Tax Revenue   Own Non-Tax Revenue  Shareable Taxes  Grants-in-aid


         Source: RBI State Finances, January 2026


         58

