


Page 41 - CII-ARTHA
P. 41
MARCH 2026


           Services: Steady But Facing New
                                                                             Figure 3: Services Sector-
           Headwinds                                                  Revenue & Expenditure Growth (y-o-y%)

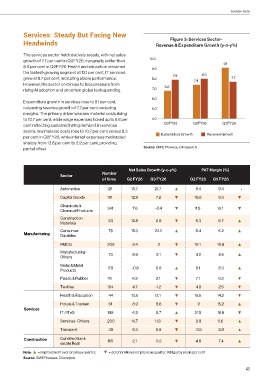
           The services sector held relatively steady, with net sales
           growth of 7.7 per cent in Q3FY26, marginally softer than   10.0
           8.0 per cent in Q2FY26. Health and education remained    9.0                             9.1
           the fastest-growing segment at 13.1 per cent. IT services                       8.0
           grew at 8.7 per cent, indicating stable performance.     8.0       7.9      7.4              7.7
           However, the sector continues to face pressure from
           rising AI adoption and uncertain global tech spending.    7.0  6.8

                                                                    6.0
           Expenditure growth in services rose to 9.1 per cent,
           outpacing revenue growth of 7.7 per cent, reducing       5.0
           margins. The primary driver was raw material costs rising
           to 10.7 per cent, while wage expenses ticked up to 6.6 per   4.0
           cent reflecting sustained hiring demand. In services            Q3FY25       Q2FY26       Q3FY26
           sector, raw material costs rose to 10.7 per cent versus 8.3
           per cent in Q2FY26, while interest expenses moderated         Expenditure Growth  Revenue Growth
           sharply from 13.8 per cent to 2.2 per cent, providing
           partial offset.                                        Source: CMIE Prowess, CII research


                                                          Net Sales Growth (y-o-y%)        PAT Margin (%)
                                              Number
                            Sector
                                              of firms      Q2 FY26    Q3 FY26        Q2 FY26    Q3 FY26

                            Automotive           121       13.7       21.7     ▲        9.4       9.4       -
                            Capital Goods        191       12.9       7.2      ▼       10.8       9.3      ▼
                            Chemicals &          341        7.6       -3.4     ▼       11.8       10.1     ▼
                            Chemical Products
                            Construction                                       ▼                           ▲
                            Materials            63        12.8       6.8               6.3       6.7
                            Consumer             78        15.3       23.1     ▲        5.4       6.2      ▲
            Manufacturing   Durables

                            FMCG                 209        9.4        2       ▼       10.1       10.8     ▲
                            Manufacturing-                                     ▼                           ▲
                              Others             73         9.9       0.1               4.2       4.6

                            Metal & Metal        179        -0.8      6.8      ▲        8.1       8.3      ▲
                            Products
                            Plastic & Rubber     111        6.2       2.1      ▼        7.1       6.2      ▼

                            Textiles             194        4.7       -1.2     ▼        4.9       2.5      ▼
                            Health & Education   44        13.5       13.1     ▼       15.5       14.2     ▼

                            Hotels & Tourism     61         8.9       8.6      ▼         9        15.2     ▲
            Services
                            IT / ITeS            149        6.8       8.7      ▲       21.5       19.6     ▼
                            Services- Others     200       14.7       11.8     ▼        9.9       11.6     ▲

                            Transport            49         6.3       5.9      ▼        -3.5      8.9      ▲
            Construction    Construction &       165        2.1       0.2      ▼        4.8       7.4      ▲
                            estate Real

           Note:  ▲ = improvement over previous quarter;            ▼ = deterioration over previous quarter. All figures are in per cent
           Source: CMIE Prowess, CII analysis

                                                                                                              41

