


Page 45 - CII-ARTHA
P. 45
MARCH 2026


           Comparison with Asian

           Counterparts                                             U-shaped female labour force
                                                                    participation hypothesis
           Applying the U-shaped hypothesis of female labour
           supply, it can be argued that female LFPR will be high in   The U-shaped hypothesis of female labour force
           low-income countries, will decline as per capita income   participation explains how women’s engagement in the
           begins to rise, and will increase again for the high-income   workforce changes as a country’s economy develops. In
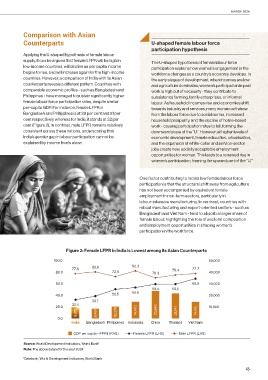
           countries. However, a comparison of India with its Asian   the early stages of development, when incomes are low
           counterparts reveals a different pattern. Countries with   and agriculture dominates, women’s participation in paid
           comparable economic profiles - such as Bangladesh and     work is high out of necessity - they contribute to
           Philippines - have managed to sustain significantly higher   subsistence farming, family enterprises, or informal
           female labour force participation rates, despite similar   labour. As household incomes rise and economies shift
           per-capita GDP. For instance, female LFPR in             towards industry and services, many women withdraw
           Bangladesh and Philippines is at 39 per cent and 51 per   from the labour force due to social norms, increased
           cent respectively whereas for India, it stands at 32 per   household prosperity, and the decline of home-based
           cent (Figure 2). In contrast, male LFPR remains relatively   work - causing participation rates to fall, forming the
           consistent across these nations, underscoring that       downward slope of the “U.” However, at higher levels of
           India’s gender gap in labour participation cannot be     economic development, female education, urbanisation,
           explained by income levels alone.                        and the expansion of white-collar and service-sector
                                                                    jobs create new, socially acceptable employment
                                                                    opportunities for women. This leads to a renewed rise in
                                                                    women’s participation, forming the upward part of the “U.”


                                                               One factor contributing to India’s low female labour force
                                                               participation is that the structural shift away from agriculture
                                                               has not been accompanied by equivalent female
                                                               employment in non-farm sectors, particularly in
                                                               labour-intensive manufacturing. In contrast, countries with
                                                               robust manufacturing and export-oriented sectors - such as
                                                               Bangladesh and Viet Nam - tend to absorb a larger share of
                                                               female labour, highlighting the role of sectoral composition
                                                               and employment opportunities in shaping women’s
                                                               participation in the workforce.


                              Figure 2: Female LFPR in India is Lowest among its Asian Counterparts

                         100.0                                                                 50,000
                                 77.6     80.6              82.3             75.4     77.7
                          80.0                     72.5              70.3                      40,000

                          60.0                                                        68.9     30,000
                                                                     59.4    59.5
                                                            53.6
                          40.0                     50.5                                        20,000
                                          38.7
                                 32.4
                          20.0                                         23,846                  10,000
                                   9,818    8,487    10,376   14,470           21,741   14,415
                           0.0
                                 India  Bangladesh Philippines  Indonesia  China  Thailand  Viet Nam

                                  GDP per capita - PPP$ (RHS)  Female LFPR (LHS)  Male LFPR (LHS)

            Source: World Development Indicators, World Bank 1
            Note: The above data is for the year 2024

           1 Databank, World Development Indicators, World Bank
                                                                                                              45

