


Page 69 - CII-ARTHA
P. 69
MARCH 2026


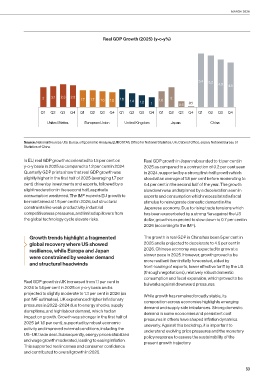
                                               Real GDP Growth (2025) (y-o-y%)


                                                                                         5.4  5.2
                                                                                                  4.8  4.5


                    2   2.1  2.3  2.2  1.7  1.7  1.6  1.5  1.8  1.4  1.2  1  1.6  2  0.6  0.1


                   Q1  Q2   Q3  Q4   Q1  Q2  Q3   Q4  Q1  Q2   Q3  Q4   Q1  Q2  Q3   Q4  Q1  Q2   Q3  Q4
                      United States    European Union   United Kingdom       Japan            China


            Source: National Sources: U.S. Bureau of Economic Analysis; EUROSTAT; Office for National Statistics, UK; Cabinet Office, Japan; National Bureau of
            Statistics of China


            In EU, real GDP growth accelerated to 1.5 per cent on   Real GDP growth in Japan rebounded to 1.1 per cent in
            y-o-y basis in 2025 as compared to 1.2 per cent in 2024.   2025 as compared to a contraction of 0.2 per cent seen
            Quarterly GDP prints show that real GDP growth was   in 2024, supported by a strong first-half growth which
            slightly higher in the first half of 2025 (averaging 1.7 per   stood at an average of 1.8 per cent before moderating to
            cent) driven by investments and exports, followed by a   0.4 per cent in the second half of the year. The growth
            slight moderation in the second half, as private     slowdown was underpinned by a deceleration seen in
            consumption weakened. The IMF expects EU growth to   exports and consumption which necessitated a fiscal
            be maintained at 1.5 per cent in 2026, but structural   stimulus to reinvigorate domestic demand in the
            constraints like weak productivity, industrial       Japanese economy. Due to rising trade tensions which
            competitiveness pressures, and limited spillovers from   has been exacerbated by a strong Yen against the US
            the global technology cycle elevate risks.           dollar, growth is expected to slow down to 0.7 per cent in
                                                                 2026 (according to the IMF).

              Growth trends highlight a fragmented               The growth in real GDP in China has been 5 per cent in
              global recovery where US showed                    2025 and is projected to decelerate to 4.5 per cent in
              resilience, while Europe and Japan                 2026. Chinese economy was expected to grow at a
              were constrained by weaker demand                  slower pace in 2025. However, growth proved to be
                                                                 more resilient than initially forecasted, aided by
              and structural headwinds
                                                                 front-loading of exports, lower effective tariff by the US
                                                                 (through negotiations), relatively robust domestic
                                                                 consumption and fiscal expansion, which proved to be
            Real GDP growth in UK increased from 1.1 per cent in   bulwarks against downward pressures.
            2024 to 1.4 per cent in 2025 on y-o-y basis and is
            projected to slightly moderate to 1.3 per cent in 2026 (as   While growth has remained broadly stable, its
            per IMF estimates). UK experienced higher inflationary   composition across economies highlights emerging
            pressures in 2022–2024 due to energy shocks, supply   demand and supply side imbalances. Strong domestic
            disruptions, and high labour demand, which had an    demand in some economies and persistent cost
            impact on growth. Growth was stronger in the first half of   pressures in others have shaped inflation dynamics
            2025 (at 1.6 per cent), supported by robust economic   unevenly. Against this backdrop, it is important to
            activity and improved external conditions, including the   understand evolving price pressures and the monetary
            US–UK trade deal. Subsequently, energy prices stabilized   policy response to assess the sustainability of the
            and wage growth moderated, leading to easing inflation.   present growth trajectory
            This supported real incomes and consumer confidence
            and contributed to overall growth in 2025.


                                                                                                              69

