


Page 70 - CII-ARTHA
P. 70
ARTHA


         B.  Trends in Inflation and                           declining energy prices and weaker industrial demand.
         Monetary Policy                                       In response to the improving inflation outlook and
                                                               subdued growth conditions, the European Central Bank
                                                               (ECB) began monetary easing, lowering policy rates by
         Broad Disinflation, Uneven Pressures and               around 75 basis points in the first half of 2025.
         Monetary Policy Divergence                            Interestingly, inflation continued to steadily decelerate to
                                                               3.8 per cent in Q3 and 3.3 per cent in Q4, as easing input
         According to the IMF, global inflation moderated to 4.1 per   costs gradually filtered through the economy, signalling
         cent in 2025, and was initially expected to moderate   sustained disinflation.
         further in 2026, mainly due to benign global commodity
         prices. Inflation dynamics in 2025 reflected a gradual but
         uneven normalization across economies. While headline
         inflation moderated in most advanced economies amid      Global inflation was  moderating
         easing energy prices and tighter monetary conditions,
         underlying pressures, particularly from services and    in 2025 but price stability
         wages, remained persistent. At the same time, weak      remains uneven, with inflation
         domestic demand kept inflation subdued in parts of the   facing severe upside risks due to
         global economy. These divergent trends shaped           rising energy prices in 2026
         monetary policy responses, with central banks changing
         rates at different paces.
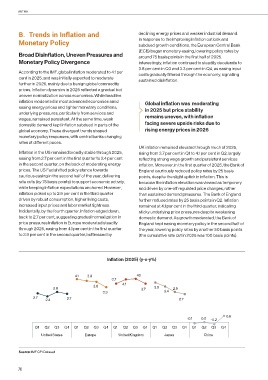
                                                               UK inflation remained elevated through much of 2025,
         Inflation in the US remained broadly stable through 2025,   rising from 3.7 per cent in Q1 to 4.1 per cent in Q2, largely
         easing from 2.7 per cent in the first quarter to 2.4 per cent   reflecting strong wage growth and persistent services
         in the second quarter, on the back of moderating energy   inflation. Moreover, in the first quarter of 2025, the Bank of
         prices. The US Fed shifted policy stance towards      England cautiously reduced policy rates by 25 basis
         cautious easing in the second half of the year, delivering   points, despite the slight uptick in inflation. This is
         rate cuts (by 75 basis points) to support economic activity,   because the inflation elevation was viewed as temporary
         while keeping inflation expectations anchored. However,   and driven by one-off regulated price changes, rather
         inflation picked up to 2.9 per cent in the third quarter   than sustained demand pressures. The Bank of England
         driven by robust consumption, higher living costs,    further reduced rates by 25 basis points in Q2. Inflation
         increased input prices and labor market tightness.    remained at 4.1 per cent in the third quarter, indicating
         Incidentally, by the fourth quarter, inflation edged down,   sticky underlying price pressures despite weakening
         back to 2.7 per cent, suggesting gradual normalization in   domestic demand. As growth moderated, the Bank of
         price pressures Inflation in Europe moderated steadily   England kept easing monetary policy in the second half of
         through 2025, easing from 4.1 per cent in the first quarter   the year, lowering policy rates by another 50 basis points
         to 3.9 per cent in the second quarter, buttressed by   (the cumulative rate cut in 2025 was 100 basis points).


                                                 Inflation (2025) (y-o-y%)


                                  4.1   3.9                   4.1
                                                   3.7
                                                       4.1
                                          3.8
                         2.9                                    3.7   3.8     2.9
                                               3.3                        3.4
                2.7            2.7
                     2.4                                                         2.7


                                                                                                     0.6
                                                                                    -0.1  0.0  -0.2
                 Q1  Q2  Q3   Q4  Q1  Q2   Q3  Q4  Q1   Q2  Q3  Q4   Q1  Q2  Q3   Q4  Q1   Q2  Q3  Q4
                   United States       Europe         United Kingdom      Japan             China


         Source: IMF CPI Dataset


         70

