
Page 13 - CII Artha Magazine
P. 13
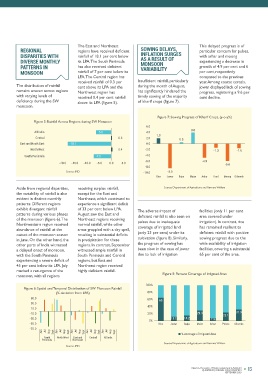
The East and Northeast                                This delayed progress is of
          REGIONAL                  regions have received deficient   SOWING DELAYS,      particular concern for pulses,
 Figure 3: Area Covered under Irrigation for Major Kharif Crops (%)  DISPARITIES WITH   rainfall of 18.1 per cent below   INFLATION SURGES   with arhar and moong
          DIVERSE MONTHLY           its LPA. The South Peninsula   AS A RESULT OF         experiencing a decrease in
 70.0                                                           MONSOON
          PATTERNS IN               has also received deficient   VARIABILITY             growth of 4.9 per cent and 6
 60.0     MONSOON                   rainfall of 7 per cent below its                      per cent, respectively
                                    LPA. The Central region has                           compared to the previous
 50.0                               received rainfall of 0.3 per   Insufficient rainfall, particularly   year. Among coarse cereals,
        The distribution of rainfall   cent above its LPA and the   during the month of August,   jowar displayed lack of sowing
        remains uneven across regions                         has significantly hindered the
 40.0  Rice  with varying levels of   Northwest region has    timely sowing of the majority   progress, registering a 9.6 per
                                    received 0.4 per cent rainfall
                                                                                          cent decline.
 30.0   deficiency during the SW    above its LPA (figure 5).  of kharif crops (figure 7).
 Jowar  monsoon.
 20.0
 Bajra
                                                                       Figure 7: Sowing Progress of Kharif Crops, (y-o-y%)
 10.0           Figure 5: Rainfall Across Regions during SW Monsoon
 Maize
                                                                  6.0
 0.0            All India                   -5.5                  4.0                 3.8
 Pulses                                                                1.9
 1950-51  1953-54  1956-57  1959-60  1962-63  1965-66  1968-69  1971-72  1974-75  1977-78  1980-81  1983-84  1986-87  1989-90  1992-93  1995-96  1998-99  2001-02  2004-05  2007-08  2010-11  2013-14  2016-17  2019-20  Oilseed  East and North East  -18.1  0.3  2.0  0.5
                 Central
                                                                  0.0
               North West                             0.4        -2.0                           -1.3      -1.6
 Source: Department of Agriculture and Farmers Welfare
            South Peninsula                -7.0                  -4.0
                                                                 -6.0                      -4.9
                           -20.0  -15.0  -10.0  -5.0  0.0  5.0                                       -6.0
                                                                 -8.0
 Pulses, while showing a trend   30 (end of SW monsoon), this   season had a delayed onset,   could not be sustained in   Source: IMD  -10.0  -8.5
 towards greater reliance on   year, India has received 820.0   resulting in insufficient rainfall   August, as the month was   Rice  Jowar  Bajra  Maize  Arhar  Urad  Moong  Oilseeds
 irrigation, still maintains a   mm of monsoon rainfall,   in June, which was 8.7 per cent   marked by a dry spell with just
 significant dependence on   representing 6 per cent   below the LPA. Nevertheless,   163 mm of rainfall, a stark 35.8   Aside from regional disparities,   receiving surplus rainfall,   Source: Department of Agriculture and Farmers Welfare
 rainfall, although this has   deviation from its long-period   July witnessed a significant   per cent below the LPA. The   the variability of rainfall is also   except for the East and
 diminished over time. Oilseeds   average (LPA). Figure 4 plots   recovery, with a generous 316   month of September is   evident in distinct monthly   Northeast, which continued to
 also continue to rely   the All-India cumulative rainfall   mm of rainfall, approximately   bringing some relief with   patterns. Different regions   experience a significant deficit
 significantly on monsoon rains,   deviation from LPA during SW   12.5 per cent above the LPA.   rainfall of 13.5 per cent above   exhibit divergent rainfall   of 33 per cent below LPA.
 with irrigation playing a limited   monsoon. The monsoon   This positive trend, however,   the LPA.  patterns during various phases   August saw the East and   The adverse impact of   facilities (only 11 per cent
 role in recent years.                                        deficient rainfall is also seen on   area covered under
        of the monsoon (figure 6). The   Northeast regions receiving   pulses due to inadequate   irrigation). In contrast, rice
        Northwestern region received   normal rainfall, while other
 Hence, it can be surmised that   abundance of rainfall at the   areas grappled with a dry spell,   coverage of irrigated land   has remained resilient to
 the dependence of foodgrain   outset of the monsoon season   resulting in substantial deficits   (only 23 per cent) under its   deficient rainfall with positive
 production on rainfall has   Figure 4:  All-India Cumulative Rainfall (% from LPA)  in June. On the other hand, the   in precipitation for these   cultivation (figure 8). Similarly,   sowing progress due to the
 markedly diminished, while   20.0  other parts of India witnessed   regions. In contrast, September   the progress of sowing has   wide availability of irrigation
 reliance on irrigation has   10.0  a delayed onset of monsoon,   witnessed ample rainfall in   been slow in the case of jowar   facilities, covering a substantial
 increased, particularly in the   with the South Peninsula   South Peninsula and Central   due to lack of irrigation   65 per cent of the area.
 case of rice and maize.   0.0  experiencing a severe deficit of   regions, but East and
 However, jowar, pulses, and   45 per cent below its LPA. July   Northeast region received
 oilseeds remain largely   -10.0  marked a resurgence of the   highly deficient rainfall.
 rain-fed, suggesting a need for   -20.0  monsoon, with all regions      Figure 8: Percent Coverage of Irrigated Area
 enhanced investment in
 irrigation infrastructure to   -30.0                             100%
 reduce dependence on   -40.0  Figure 6: Spatial and Temporal Distribution of SW Monsoon Rainfall
 monsoons.                (% deviation from LPA)                  80%
 -50.0         50.0                                               60%   65
               30.0
 SW MONSOON ENDS   -60.0  10.0                                    40%
 AT 6 PER CENT   -70.0  -10.0                                     20%                    29.3       23.1  31.9
 DEFICIT FROM ITS   -30.0                                          0%        11.1  15.2        7.9
 LPA  01-Jun-23  12-Jun-23  23-Jun-23  04-Jul-23  15-Jul-23  26-Jul-23  06-Aug-23  17-Aug-23  28-Aug-23  08-Sep-23  19-Sep-23  30-Sep-23  -50.0  Rice  Jowar  Bajra  Maize  Arhar  Pulses  Oilseeds
              -70.0
                                                 Jul
                                          Jul
                                   Jul
                    Jun
                     Jul
                              Aug
                            Jul
                     South Aug  Sept  Jun  North West Sept  Jun  East and Aug  Sept  Jun  Central Aug  Sept  Jun  All India Aug  Sept  % coverage of Irrigated Area
 India has overall experienced   Source: IMD  Peninsula  Northeast
 normal monsoon rainfall in   Source: IMD                                 Source: Department of Agriculture and Farmers Welfare
 recent years. As of September
 12  ANALYSIS, RESEARCH, THOUGHT LEADERSHIP & ADVOCACY                                ANALYSIS, RESEARCH, THOUGHT LEADERSHIP & ADVOCACY  13
                                                                                           QUARTERLY JOURNAL OF ECONOMICS
 QUARTERLY JOURNAL OF ECONOMICS
 SEPTEMBER 2023                                                                                      SEPTEMBER 2023